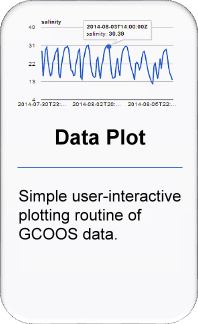
The following describes how to use the plotting routine of the GCOOS data portal. The link in the 'Monitoring' tab to list the GCOOS assets (https://data.gcoos.org/admin/get_gcoos_assets.php) provides a comperehensive list of possible values (hereafter referred to as simply 'Assets'). The 'Assets' table changes as the portal is upgraded, data sources added or removed.
The general syntax of the HTTP command to plot GCOOS Data is:
https://data.gcoos.org/plotData.php?network=<organization>&station=<station or platform name>&obs=<phenomena measured or observation type>{&sensorNumber=<sensor number>&rec=<24h || 7d || 30d>&width=<width in pixel>&height=<height in pixel>}
where <organization> can either be TABS || TCOON || COMPS || LUMCON || WAVCIS || DISL || CenGOOS || NDBC || NOS || NERRS || ADCP || SCCF RECON || COAPS || FWRI
NOTES:
- 'rec' (default is '24h'), 'header' (default is 'yes'), width (default is 170px) and 'height' (default is 129px) are optional parameters.
- In some cases, a platform may have more than one sensor to measure a phenomenon (e.g. currents). The 'sensorNumber' is in reference to the depth (refer to the 'Assets' table) at which the observation was made. The default value for this is '1', i.e. the first sensor as listed.
- The rec' parameter can only be: (1) '24h' to plot the data collected in the last 24 hours, (2) '7d' to plot the week long data or (3) '30d' to plot the data collected in the last 30 days. The default is '24h'.
EXAMPLE:
To plot the 'airTemperature' data from '42003' station of NDBC for the last 24h, in a 300px by 200px plot:
https://data.gcoos.org/plotData.php?network=NDBC&station=42003&obs=airTemperature&sensorNumber=1&rec=24h&width=300&height=200
|


